Article written by Simon Jahan – ActinVision BI Consultant
When data analysis relies on AI
Tableau’s latest innovation, named Tableau Pulse, promises to radically transform the way users interact with their data. Replacing the Ask Data and Tableau Metrics features, Tableau Pulse offers a completely redesigned user experience focused on democratizing data visualization. This feature is exclusive to Tableau Cloud and therefore does not apply to Tableau Server instances. At the time of writing, Pulse is only available in English.
What is Tableau Pulse?
The aim of Tableau Pulse is clear: to bring data together in a single, reliable place, and to offer a return that is accessible to all, whatever their level of expertise in data analysis. This new functionality is designed to help users identify relevant, actionable indicators, while enabling each user to answer their own questions thanks to an intuitive interface. Thus, any user with an Explorer role (can publish) or higher can, through the very simple interface (even more so than that of Tableau Desktop or Web Edition), create a metric.
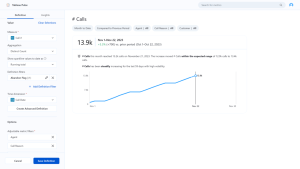
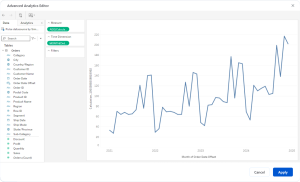
Interface for creating a metric definition
How does it work?
In its current version, questions are suggested to users by Tableau Pulse, providing relevant answers instantly. At a later date, it will be possible to interrogate it in natural language with personalized questions, following the example of the conversational AI applications now widely used.
Unlike traditional dashboards that respond to specific questions and needs, Pulse gives users the freedom to create their own personalized, contextualized metrics, accessible on all devices, from PCs to smartphones.
An interesting feature of Tableau Pulse is the ability for users to react to metrics by “liking” or “disliking” them, enabling the tool to rank metrics by relevance according to user profiles. The community aspect of this feature also includes the ability to share and subscribe to metrics, so that they appear on the Tracked Metrics Dashboard.
Access permissions to metrics are managed directly in the Pulse interface, while respecting the data access rules defined in the Tableau Cloud data source.
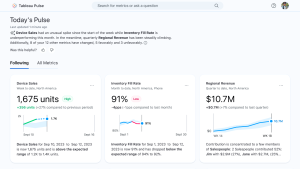
Dashboard of metrics monitored
First steps
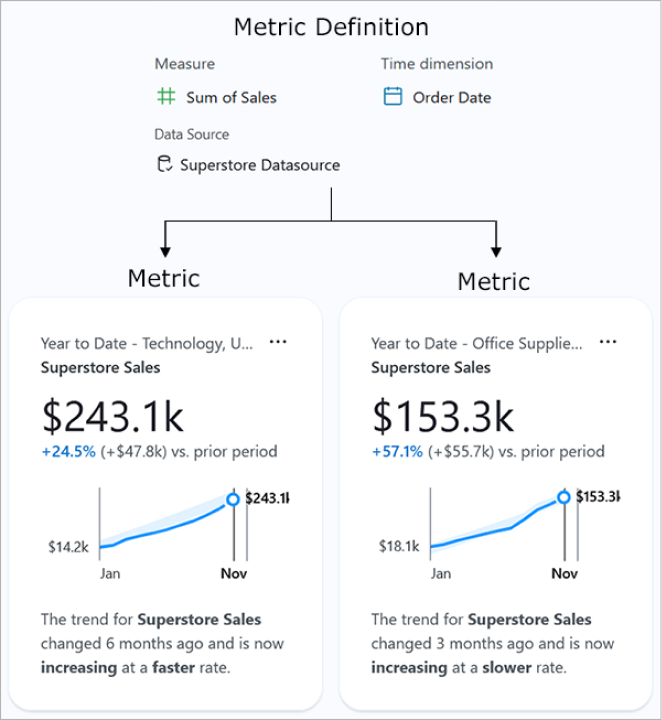
Simply create a definition consisting of a measure (e.g. SUM(Sales)), a dimension (e.g. MONTH (Order date)) and one or more dimension filters (e.g. Country, Customer name, Category, etc.).
From this definition, it is possible to create one or more metrics that present the definition according to different filters. For example, you can have one metric presenting the evolution of sales in France compared to the previous year, and another metric comparing the sum of sales for a specific category from one month to the next.
From definition to metrics
AI for data analysis
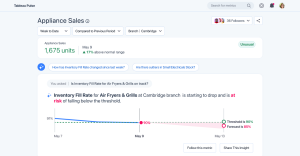
What sets Pulse apart from Tableau’s classic approach is its use of artificial intelligence to analyze metrics and provide in-depth insights. By studying data evolutions, unexpected behaviors and trends, Pulse identifies concentrations of values, anomalies and patterns, enabling users to dig deeper into the analysis to find their causes. From a metric, users can select a question proposed by Tableau, and gain a deeper understanding of the evolution of the data presented.
Deepen your understanding of data with predefined Tableau Pulse questions
Prerequisites
To work with Tableau Pulse, you need to have a data source published on Tableau Cloud, which requires upstream work on the data. Connections can be live or extracted, and data must be regularly updated. Fine data granularity, exhaustive history and fresh data are also recommended to optimize results.
Reviews after use
Having explored the Tableau Pulse feature in depth, here are my impressions of its use and performance. Of course, Pulse is still in its first version, and there will be many updates and fixes to come.
Ease of use
Access to Pulse and its various options is particularly quick and intuitive. Metrics can be created in just a few clicks, enabling rapid data analysis.
Insights presentation
The insights presented on the home page are relevant and offer easy access to the associated metrics. In addition, the ability to define dimensions to deepen the analysis is a major asset, although this can potentially restrict the analysis if not all relevant dimensions are filled in when defining the metric.
The limits
It’s important to note that this first version still contains some errors, notably error messages when creating or saving definitions. What’s more, some existing Desktop and Web edition functions, such as cumulative sum and multiple pill selection, are either not functional or absent at present.
What’s more, for the creation of calculated fields and advanced editing of metrics, the user is faced with the Tableau Desktop / Web Edition interface. This can make it less accessible to users unfamiliar with this interface. Once again, it’s crucial to prepare your data in advance.
There are some limitations, such as the need for fresh data (last month at least) to view metrics without obtaining NULL values. Or the requirement for a minimum monthly aggregation in date fields to enable Pulse analysis.
Finally, the types of visualization available are still restricted to bar graphs and sparklines.
Despite these limitations, Tableau Pulse promises to be a powerful tool once these bugs are ironed out and its functionality expanded to meet more diverse analytical needs. This first version will enable you to get to grips with the interface and begin initial analyses, before being able to take full advantage of Pulse in future versions.
In summary, Tableau Pulse represents a significant step forward in the Tableau ecosystem, offering users a new and intuitive experience, powered by artificial intelligence. By combining the power of artificial intelligence with the variety of Tableau Cloud features, Tableau Pulse promises to profoundly change the way companies derive insights from their data, making data analysis more accessible, actionable and efficient than ever before.