Article written by Arina Malova – ActinVision BI Consultant
According to publisher Tableau, the sector has undergone two major phases of evolution in recent years: the first emphasized the importance of a complete service, requiring programming to generate insights, while the second introduced the use of self-service to enable users to create their insights without coding skills.
Data culture, a pillar not to be neglected
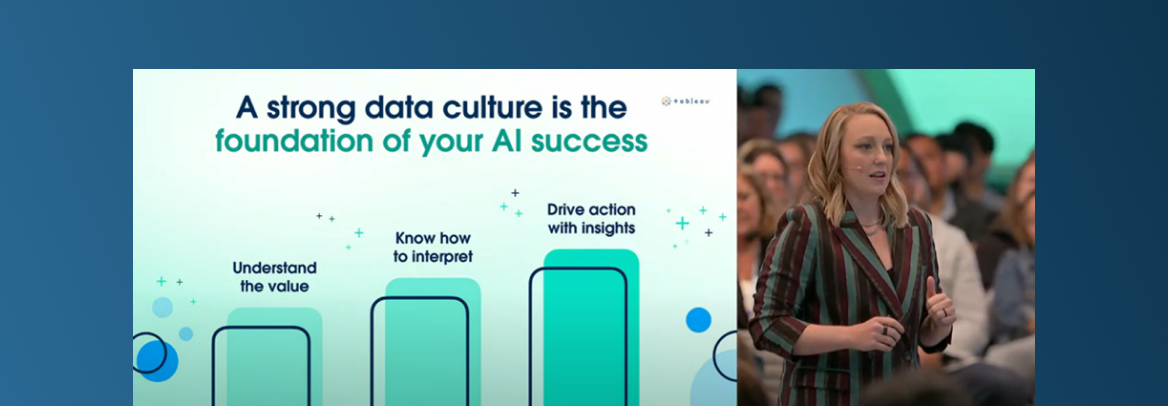
At this 2024 edition of the Tableau conference, a third phase seems to have been identified, focused on personalization and the impact of artificial intelligence in users’ interactions with data and insights. The aim is to make data and AI accessible to all. So, with AI at the center of discussions, two keywords emerged: trust and culture. Particular emphasis was placed on the importance of a solid data culture within organizations, which is essential for responding to new industry usages. At Salesforce, this culture is embodied by the Tableau Community, as a pillar of adoption, education and creation.
A true key success factor, customer feedback demonstrates the positive impact of this data culture: transforming laborious manual processes, creating a feedback loop with business users, and above all maintaining a certain competitiveness. At Actinvision, we offer a specific program to encourage user adoption and commitment: Data Engage. We support our customers not only from a technical point of view, but also from a human, managerial and community point of view, to help them get on board and become data-driven!
New AI-based features
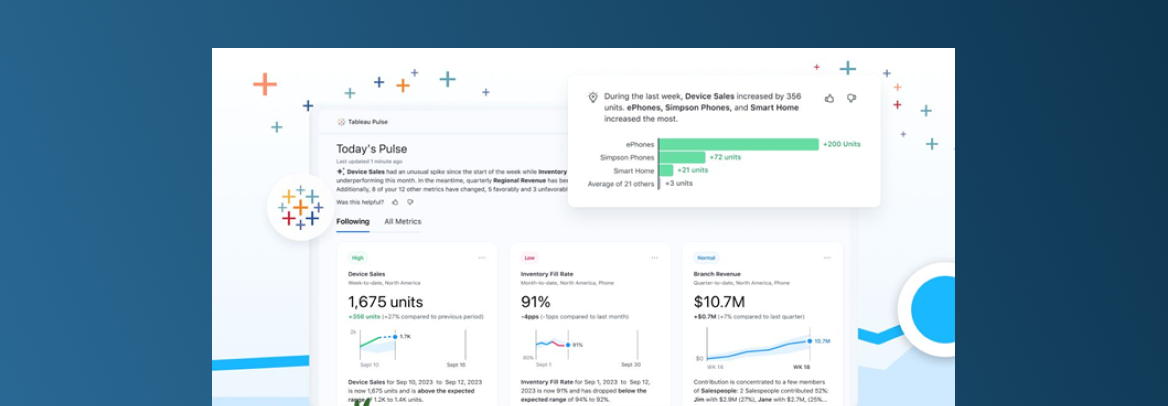
To meet this accessibility challenge while maintaining unambiguously reliable insights, the Speakers introduced two excellent AI-based products: Tableau Pulse and Einstein Copilot for Tableau. Tableau Pulse, with its Metric Bootstrapping, automatically deploys AI-recommended metrics from dashboards. Pulse’s objectives are multiple: to enable goal-setting, progress tracking and question-and-answer functionality.
Einstein Copilot, a new feature based on artificial intelligence, is available for Tableau Prep and Tableau Catalog. This conversational assistant is based on transparency, and saves time between data preparation and visualization. Copilot enables calculations and visualizations to be created in natural language, promising greater confidence and accuracy thanks to the Einstein confidence layer. Data analysis has become more accessible and more powerful than ever.
The combination of a strong data culture, AI and a high-performance analysis tool like Tableau promises new perspectives for businesses, enabling them to make the most of their data in their decision-making.
Release of new visualization extensions
Highly anticipated by users, future Tableau extensions were also introduced at the conference. These extend the range of functionalities and visuals offered by the visualization tool, with designs that can be shared via Tableau Exchange and with the Tableau community.
These extensions offer the possibility of integrating custom visualizations into Tableau’s analysis capabilities. They can be created with any JavaScript visualization library and integrated into the Tableau experience via the Extensions API. In fact, Actinvision has contributed to these developments, with two new extensions now available:
Radial chart: This extension provides a radial chart visual on Tableau. It can be used to compare a number of indicators through an elegant, easy-to-interpret visual presentation. Compared with a bar chart, the radial chart is ideal for highlighting differences between indicators, while maintaining visual clarity.
Sunburst: This extension enables you to obtain a Sunburst visual on Tableau. Sunburst is a circular graphic representation that divides data into concentric sections. Each section represents a category or sub-category, and the size of each section indicates its relative importance. It is useful for visualizing the distribution of data at different levels of detail, such as product categories and sub-categories. It’s a clear, visual way of understanding data structure.
New features added to Tableau
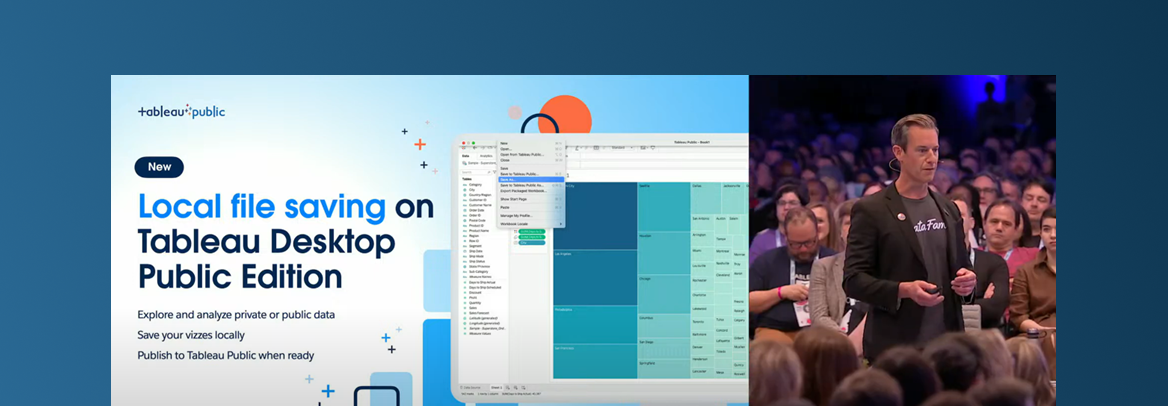
As part of its mission to help everyone see, understand and act on data, Tableau has announced that it is extending the functionality of Tableau Desktop Public Edition. From now on, users will be able to work with their data securely and save it locally on their computer, or share it online with the Tableau Public community. This evolution enables a greater number of Tableau users to explore data and use the tool.
Speakers also discussed the integration of composite data sources. This new feature will enable users to enrich centralized and certified data with additional information, such as derived and dependent data sources, without the risk of impacting certified data. Data is up-to-date and synchronized, as upstream changes to master data are automatically reflected in the sources. This automatic synchronization saves valuable time and reduces data transfer costs.
A future vision of Tableau
To conclude, Tableau looks to the future with a series of challenges:
Large, fragmented data landscape: With an increasingly large and fragmented data landscape, it has become essential to be able to bring together and analyze data from multiple sources in an efficient and consistent way. Lack of trust in data and insights: Another major challenge is the lack of user trust in data and the insights derived from it. Without this trust, it is difficult for companies to make informed decisions based on data analysis.
Underestimating or ignoring insights: Often, valuable insights from data are either underestimated or ignored. This can be due to ineffective presentation of the data, or shortcomings in the way insights are communicated to decision-makers. Lack of reusability of analyses: Finally, a major challenge is the lack of reusability of what has been built. All too often, analyses and data visualizations are created for a single use, wasting time and resources.
To overcome these challenges, Tableau focuses on developing solutions that simplify data management, increase user confidence in insights, highlight the most relevant insights and enable effective reuse of data analysis and visualization.