The year 2023 has seen a significant shift in the data visualization landscape, with the emergence of artificial intelligence (AI) not only as a complement to traditional tools, but also as a driving force behind a transformation in our usage. Established technologies are now actively integrating AI at the heart of their own tools, while new technologies are entering the market and highlighting AI as their core functionality. This transition is completely reshaping the way professionals interact with information and exploit the opportunities offered by AI.
So let’s take a look at these new AI-powered datavisualization tools.
IntelligenceArtificialDatavizInnovation
Metamorphosis of traditional tools
The integration of AI within traditional data visualization technologies, such as Tableau and Power BI, is no longer limited to a simple add-on feature. These players are actively reinventing their tools to feature integrated artificial intelligence, redefining the norm by offering solutions where AI is no longer an option, but a central element.
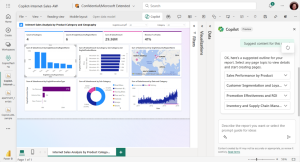
Microsoft Copilot
Microsoft Copilot for Power BI is an artificial intelligence (AI) tool that enables users to create and modify Power BI reports faster and more easily. Based on advanced linguistic models, Copilot understands natural language queries and automatically generates relevant graphs. This makes the creation of visualizations faster and more accessible even for those unfamiliar with technical queries, and in particular the DAX language. Copilot can therefore help users of all skill levels to create more effective Power BI reports.
Copilot is currently available as a private pre-release for Service Power BI.
Source : Microsoft
GPT table
Tableau GPT merges the advanced visualization capabilities of Tableau with the artificial intelligence of GPT (Generative Pre-trained Transformer). This combination makes it possible to highlight important points from the data, propose visualizations and also anticipate the next request. Data security is also emphasized, as GPT is directly integrated into the tool, avoiding the need to enter sensitive data into the open-source GPT Chat application.
Tableau GPT is available in Tableau Prep to automatically calculate certain requests (e.g.: calculate a regex for extracting JSON data from a source). A co-pilot version is scheduled for release later this year.
New technologies
New technologies are entering the market, positioning AI as their core functionality. The focus on AI is aimed at simplifying the user experience while delivering richer analytics.
ThoughtSpot and Veezoo are notable examples of this trend, offering AI-centric data visualization experiences from the outset.
ThoughtSpot
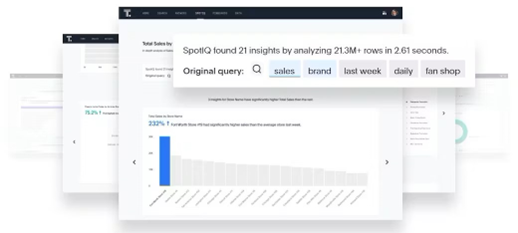
ThoughtSpot uses artificial intelligence to anticipate users’ analytical needs. SpotIQ technology, integrated into the ThoughtSpot platform, uses AI to automate the discovery of insights in data, offering users faster, smarter exploration, and suggesting relevant analyses and visualizations in real time. ThoughtSpot ensures proactive decision-making by identifying emerging trends, thus enabling prediction of future results to take preventive action where necessary.
ThoughtSpot’s strength lies in its ability to offer a complete analytical platform that is accessible to the business without depending on technical teams.
Source : ThoughtSpot
Veezoo
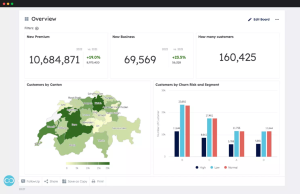
Veezoo is another AI-based data visualization solution that enables users to ask questions about their data in natural language and receive visualizations and dashboards in response. The user interface is specially designed for an optimal self-service analysis experience, guiding users with features such as auto-completion, and question suggestions.
Like ThoughtSpot, Veezoo can automatically generate data visualizations from any type of data. Users can choose from a variety of visualizations, including charts, tables, maps and diagrams.
Veezoo is a flexible data visualization solution available as a cloud service, which can be used by users of all skill levels.
Source : Vezoo
Challenges and opportunities
The integration of AI is fundamentally redefining the way professionals interact with data. This technological revolution therefore raises the challenge of adaptation. Data professionals must acquire new skills, new habits of use, and adjust to a dynamic where analysis is now boosted by AI.
As AI is not completely independent, it also needs to be trained to improve the relevance and accuracy of its proposals.
This redefinition of the analytics landscape also represents its share of opportunities. The automation of repetitive tasks enables data analysts to focus on more complex analyses and the interpretation of more nuanced results, generating a synergy between human skills and the capabilities offered by AI. This also enables independence for business teams, who can build customized dashboards without the help of technical teams.
The year 2023 represents a significant turning point in the field of data visualization, where the integration of artificial intelligence is no longer just an additional feature, but becomes a transformative driving force. Data professionals are faced with significant opportunities and must simultaneously overcome challenges to keep pace with a constantly evolving field. This is redefining the nature of data visualization, laying the foundations for an era where human expertise must work closely with artificial intelligence to continue driving the profession forward.