Votre agence Data
Révélons ensemble votre potentiel
De la définition à la réalisation avec nos experts dédiés, faisons de vos données un atout majeur. Améliorez vos performances et devenez Data Driven avec nous dès aujourd’hui.


Nos partenaires
En partenariat avec des acteurs majeurs, nous proposons des services et solutions autour du stockage, traitement et de la visualisation de données. Ces alliances renforcent notre capacité à vous aider à exploiter pleinement la puissance de vos données.


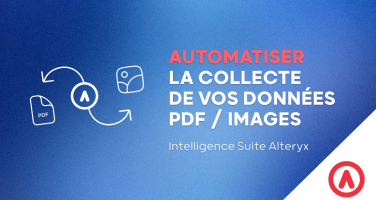
Automatiser la lecture de factures PDF
Jeudi 21 mars 2024
Libérez-vous des tâches manuelles chronophages et optimisez le traitement de vos factures avec Alteryx ! Rejoignez notre prochain webinaire et découvrez comment l’Intelligence Suite développée par Alteryx peut vous aider à automatiser l’extraction des données chiffrées des PDF grâce à la vision par ordinateur.
Inscription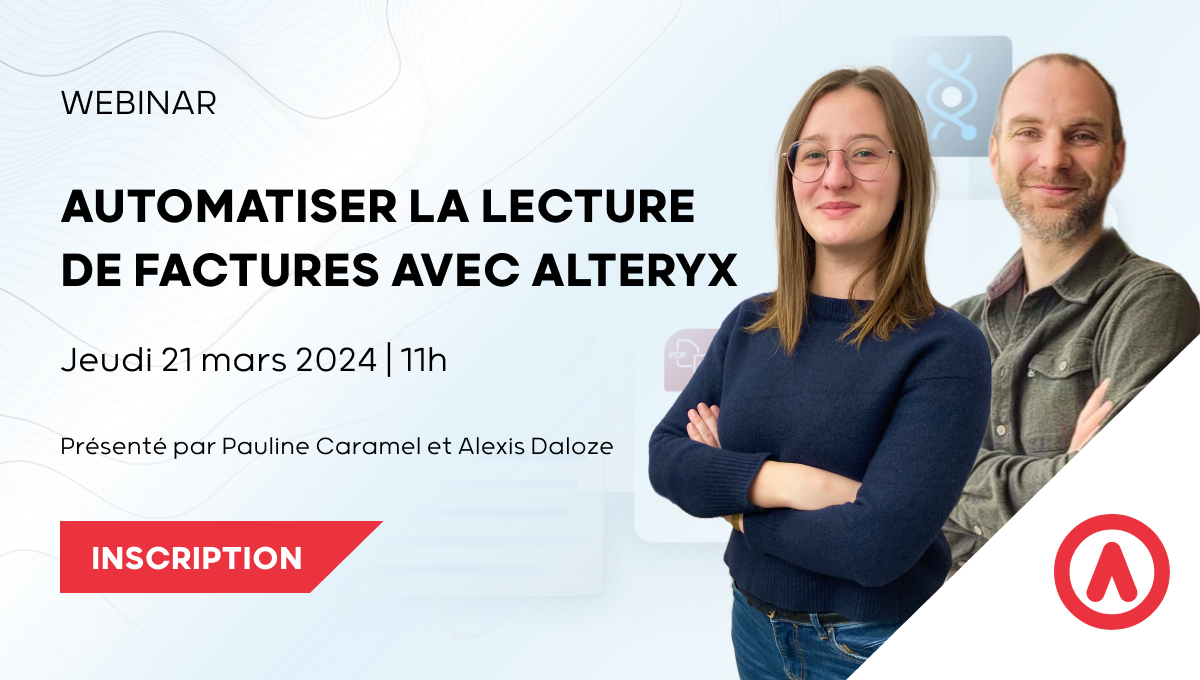
Notre communauté
Ils nous font confiance pour libérer la puissance de leurs données, transformer leurs opérations et façonner des décisions stratégiques. Ensemble, nous construisons un avenir basé sur l’excellence, où chaque succès renforce notre engagement à innover.